
Introduction
A denial-of-service attack (DoS attack) or distributed denial-of-service attack (DDoS attack) is an attempt to make a computer resource unavailable to its intended users. Although the means to carry out, motives for, and targets of a DoS attack may vary, it generally consists of the concerted efforts of a person or people to prevent an Internet site or service from functioning efficiently or at all, temporarily or indefinitely.
One common method of attack involves saturating the target (victim) machine with external communications requests, such that it cannot respond to legitimate traffic, or responds so slowly as to be rendered effectively unavailable. In general terms, DoS attacks are implemented by either forcing the targeted computer(s) to reset, or consuming its resources so that it can no longer provide its intended service or obstructing the communication media between the intended users and the victim so that they can no longer communicate adequately.
For more information on DoS attacks visit Wikipedia
Using http Log Viewer
DoS attacks normally result in an abnormal number of requests (hits) in a short period of time whereby in many cases most of these hits end up being errors. There is no straight forward way to avoid having your web server attacked by certain DoS attacks. http Logs Viewer can only help you to identify the attacks so that with such information the risk of attach can be reduced.
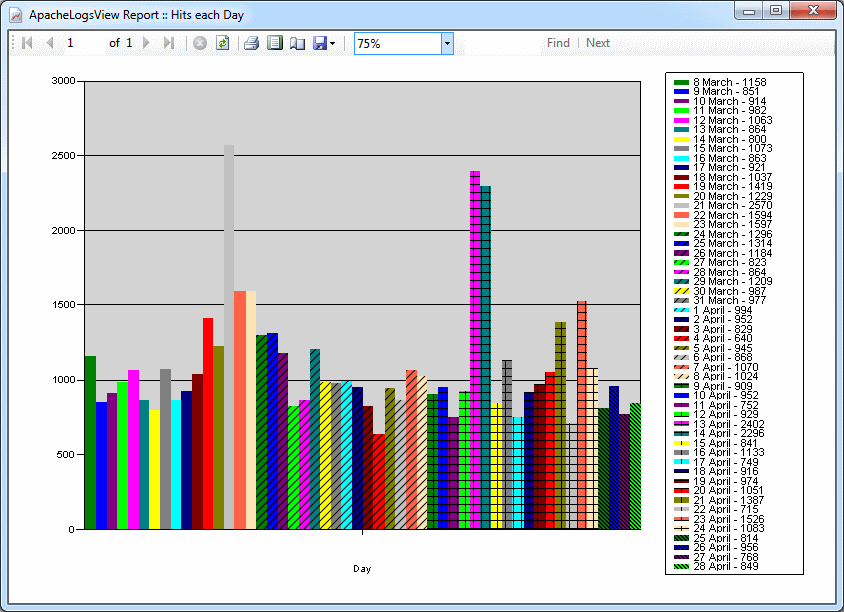
The first step one should do is to identify the day when the attack was encountered. This can be done by generate a report for a month to identify on which period (day) there was an abnormal amount of hits. This would indicate that on that day the site was attacked and or some resource was extensively consumed.
Generate the Hits Each Day Report
The second step once this day has been identified is to identify the hour when this abnormal number of hits where generated.
Generate the Hits per Hour Report
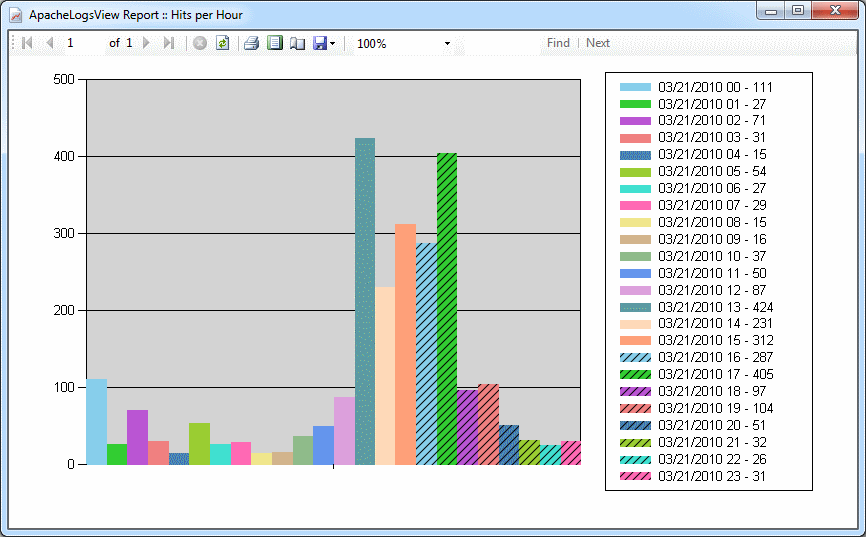
This should give an indication to which hour. Now you can scroll the log window to determine the type of requests. You can also generate a report for Hits per Hour for Request. Such a report would give you an indication to the number of requests per hour.
If you want to determine the number of hits a particular IP made for a request which ended being a client/server error you can run the Error IP Addresses Statistics. This will give you the list of IP Addresses and the number of hits they made which resulted in an error (4xx – 5xx status code). You can also filter by such Error IP Addresses. To do so click on the Filter IP Addresses button and select Error IP Addresses.
Once the following has been done it is possible to identify the request being requested and the country and originating IP of the client.
The action taken can be thus based on the result of such an analysis.
The actions could be:
- Remove some particular resource which takes bandwidth to download and/or processing time to generate.
- Add some resource which responds differently when a particular IP accesses the website
- Create firewall rules to block a specific IP Address
- Redirect specific hosts
- And more…


